Multiple Series with Kusto
Kusto has to be my favorite thing to learn these days, it’s as rewarding as learning PowerShell because it’s an abstraction over so many things. In PowerShell you really only need to know about five commands to get started, and in Kusto it feels the same way. Once you know how to choose a table and get some rows you are already dangerous. The fun lately has been getting beyond the noob commands and into some trickier commands that have a ton of value.
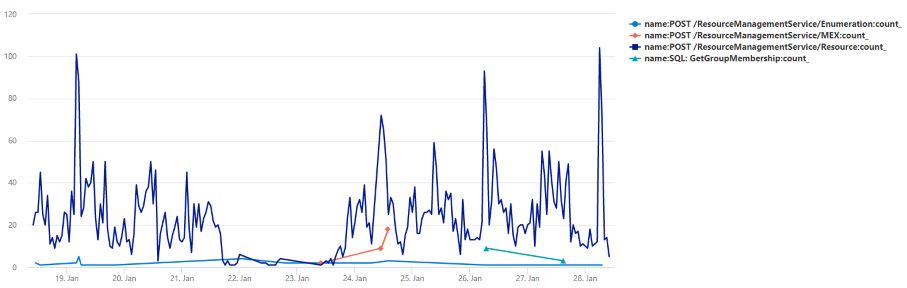
This scenario is really useful for me, showing multiple series on a chart, and counting them by some time interval.
I’m often trying to answer the question, “How often does this occur?” when investigating an issue to see if the issue is new (it occurs more lately) or if it has always been that way (it occurs about the same amount over time). The KQL sample shows how to do that. In the sample I have a table named dependencies created by Application Insights. The application in this case communicates with SQL Server and with the MIM Service web service endpoints, so the dependency name will relate to SQL or MIM.
// How many dependencies are failing per hour?
dependencies
| where timestamp > ago(10d)
| where success == 'False'
| summarize count() by name, bin(timestamp, 1h)
| render timechart